Datathon Tracks
To choose a track for your team, submit your choice here by Saturday the 6th at 4pm EST: https://forms.gle/3jGYuxJbpvzbJdoWA. The choice is final, so think it over as a team before submitting!
In addition to the information below, full information about all three tracks are available here (requires NYU login): https://docs.google.com/document/d/e/2PACX-1vS1-LZisvTjE7qKXcrUZaw84BN84IDR9cNILyL9GU_-4lRE-er6wL_ItQ_AmQ74DNYdX2eY0fZtxcYR/pub [direct download].
Stepping Through History
ProQuest Historical Newspapers
About the data: ProQuest Historical Newspapers collection contains machine-readable full text and accompanying metadata for newspapers at the individual article level for 26 historical newspapers. There are 55 million digitized pages covering from the 1800s to 1900s. One feature of newspapers that has a long history is advertisements. In this dataset, each advertisement is labeled so that we are able to analyse them separately.
Challenge Goals: What if we were to hold a century’s worth of newspaper advertisements and their features in one dataset? What could we learn about the companies who have advertised and the products they have presented? What do we need to do to obtain information from unmarked text produced by OCR software? The challenge has three goals: to extract elements from historical newspapers, to fix OCR errors in scaled files, and to use NLP in identifying different elements of advertisements.

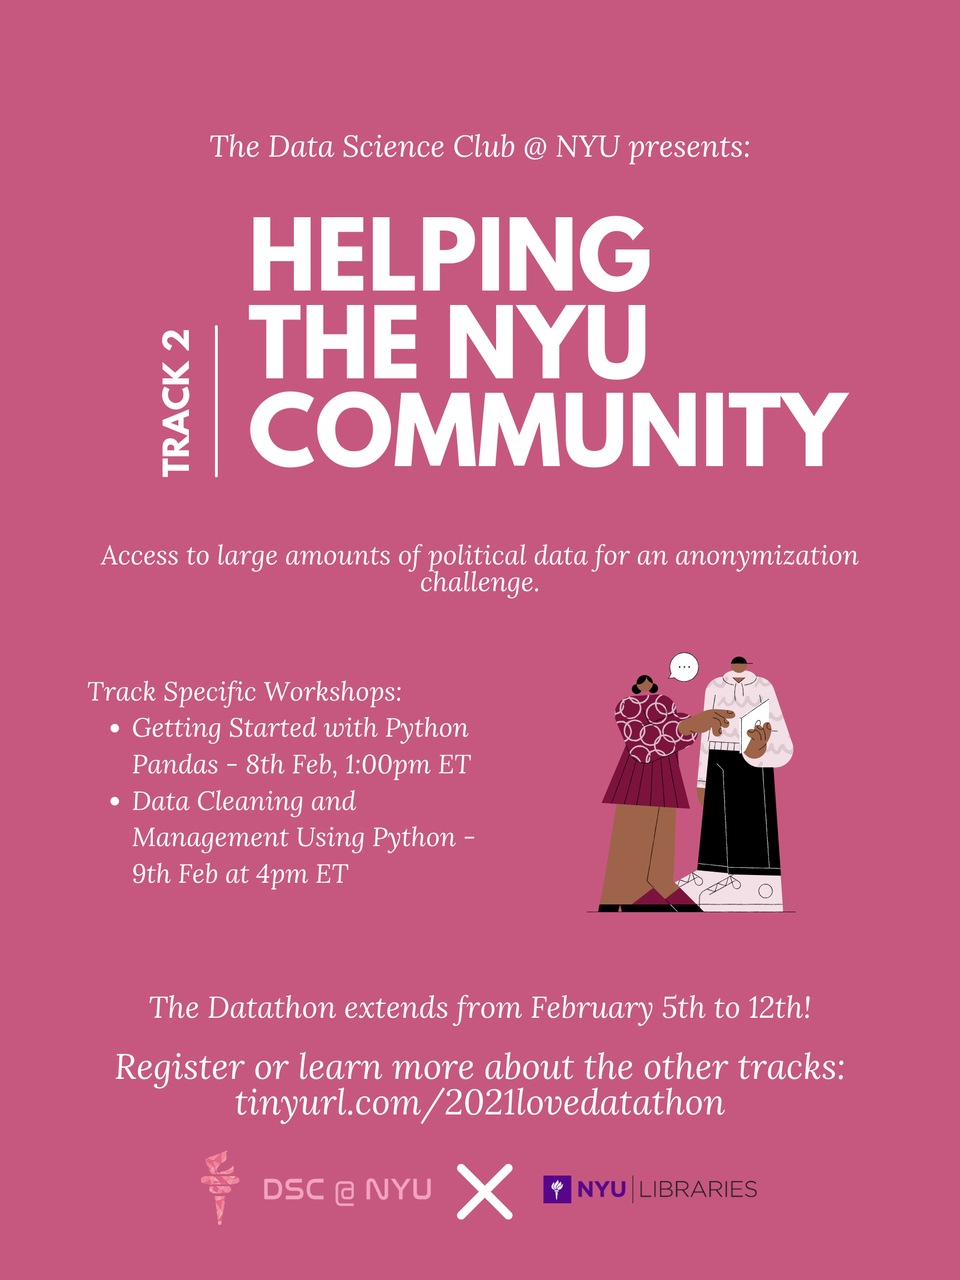
Helping the NYU Community
L2 Political Extracts
Trailer video | Full videos part 1, part 2
About the data: NYU libraries licensed L2 Political’s voter file, historical voter file, and they continuously update the database of registered voters in the States including socio-demographic indicators (some of which are modeled), consumer preferences, political party affiliation, voting history, and more. The data is fairly well-structured. You can learn more at the research guide.
Challenge Goals: The challenge has two primary goals: to generate “surrogates” of this data that are created to increase anonymity of voters in the file (this will help others at NYU to use it more freely), and to expand the ability of users in operating with these files responsibly (this will build better scripts for users and make data more attainable).

Mapping Climatological Futures
India Meteorological Data
Trailer video | Full videos: part 1, part 2, part 3
About the data: NYU Libraries has licensed grid point data that represents amounts of rainfall, temperature ranges, and measures of humidity over the 20th century in India at the district level. According to a June 2020 article in the Washington Post, India plays a pivotal role in the potential for survival in our current climacteric. The India Meteorological Department Climate Centre data is a rich dataset with many possibilities.
Challenge Goals: This is the "sandbox" data challenge -- we don’t have a specific goal but teams can choose to tackle several angles. Some ideas from us include: developing a well-documented notebook with code and examples that make the confusing directory structure easier for non-experts to use; developing more GIS-friendly products, such as rasters, shapefiles that are aggregated to the district level, etc. that would have free-standing research value.
