Research Day 2019 was a success! Some 250 visitors made their way to NYU Library’s Research Commons to hear speakers, talk with data providers, participate in the AR/VR booth provided by Teaching and Learning with Technology, and check out our Augmented Reality Sandbox. Many thanks to all of our partners, researchers, and staff for participating! Check out the roundup on NYU IT Connect.
Once again we offered a visualization competition in which entrants could submit a map or visualization to compete for a prize. Our three winners were Yichun Liu, MS candidate in the School of Professional Studies, Emily Fenster, MA candidate in the Department of English, and Patrick Bond, MS candidate in Interdisciplinary Studies.
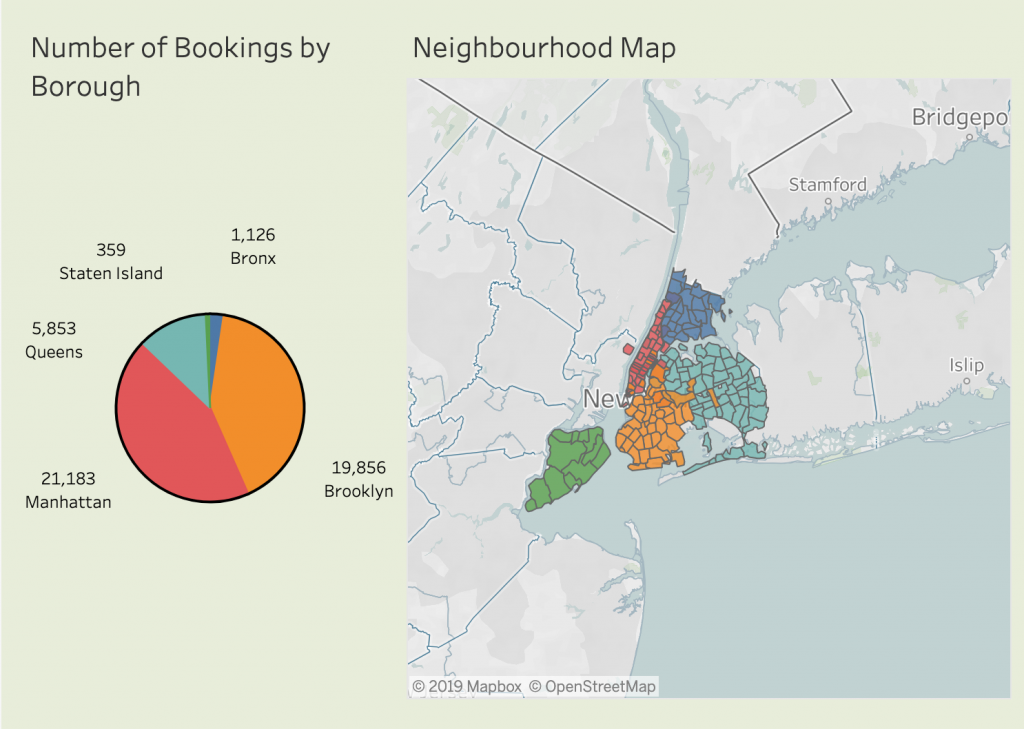
Liu’s interactive dashboard of plots and maps explores the place of Airbnb in New York City using data on listing pricing and types. Built in Tableau Public, Liu’s visualization can be accessed here.
Fenster’s visual storytelling was built in ESRI StoryMaps using data gleaned from the nineteenth-century missionary work of Henry Chase and the Mariner’s Church among the sailors of New York’s Lower East Side. Follow her visualization story here.
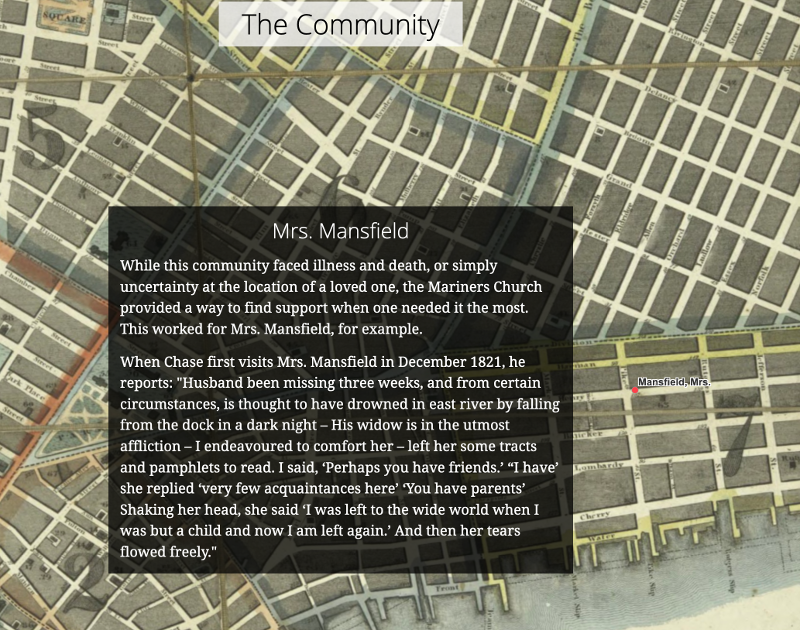
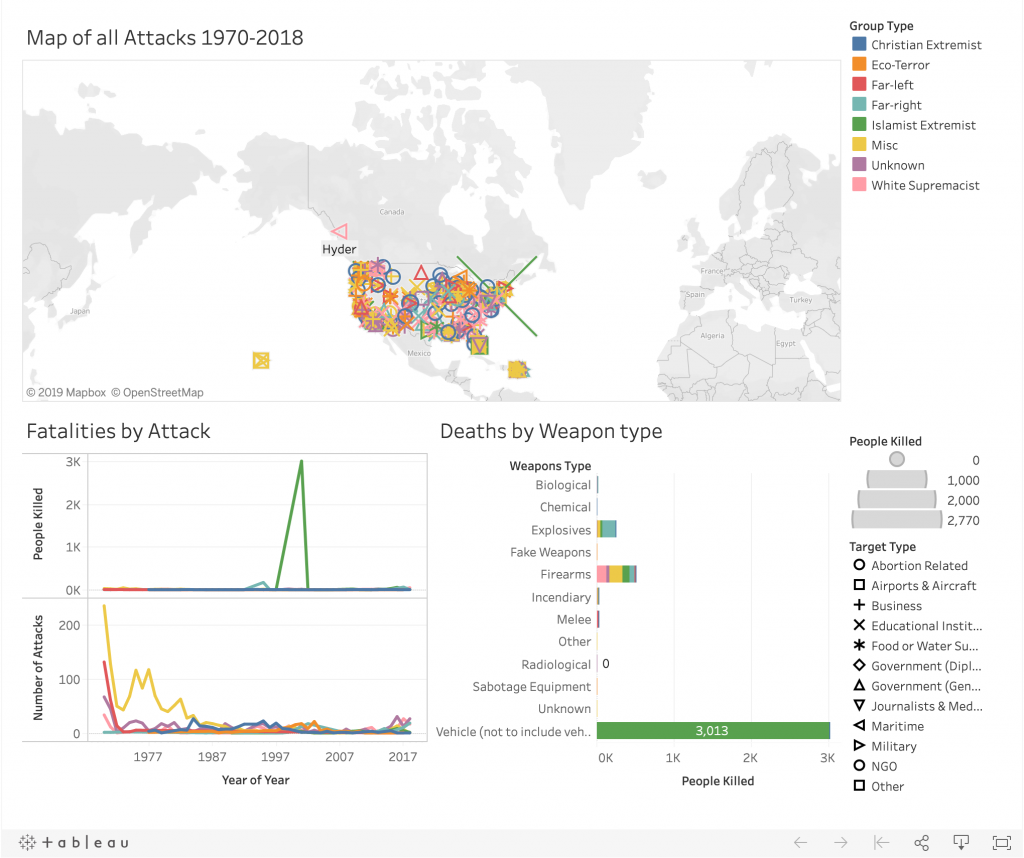
Tableau Public was also the tool of choice used by Bond to build his investigation of terror attacks in the United States between 1970 and 2018, a project built out of data from the National Consortium for the Study of Terrorism and Responses to Terrorism.
Congratulations to all of our winners and our thanks to the many researchers who submitted entries!
